
Data Quality Meetup #6
Get an overview of the Data Quality Meetup #6. With speakers from Yelp, Patreon, Convoy, and Lightdash, the event included lightning rounds on data quality best practices and approaches from leading data-driven companies.

Host: Gleb Mezhanskiy
Guests/Speakers: Maura Church, Chad Sanderson, Daniel Dicker, Benjamin Douglas, Oliver Laslett
Setting Sisyphus Free: Data Discoverability in a Scaling Company
by Maura Church, Director of Data Science, Patreon

Patreon’s journey of trying to scale data discoverability as the company has been growing rapidly while continuing to have a pretty small data science team.
About Patreon
Our mission is to fund the creative class, and we think about that as making it so that every creator in the world can make a living from their art directly from their fans via membership. And as a result, hopefully, Creatives can make money and not have to do as many brand deals or rely as much on advertising or streaming revenue, which definitely doesn’t give as much money directly to creators.
About Data Science at Patreon
The data we’re working with are payments data, as well as you know, General Mobile App Data, like conversion rates and traffic, and then lots of content, data, images, posts, videos, audio, tons of user-generated content from creators and their fans. The entire organization has 300 people across the globe and 11 data science people supporting that; we have a full-stack data science team. So everything from analytics to data science to machine learning, machine learning engineering, Ops, and BI. And for about two years, we’ve been pretty focused on scaling data discoverability.

**
Like Sisyphus, data teams often answer the same basic questions over and over again.**
The work of the data science team often feels like being Sisyphus: The data team, usually small, is overwhelmed by a steady flow of minute questions from the larger organization. The volume of these requests feels as large as Sisyphus’ boulder, and just like Sisyphus, once all questions are addressed, it all starts again with seemingly similar and mundane questions.
This is not about self-serve, which is a whole other complex issue.
This is about the challenge where you have many data assets, dashboards, analyses, insights, models, and you want your company to find and understand them and use them to make decisions.
The way this felt for the data scientists was like being too reactive or not getting done any of the work planned for the day because of time spent helping to answer data questions. Or they wished they could work on bigger analytical projects, on rigorous, methodologically challenging analyses.
So here’s the approach I’ve taken and the work we’ve done at Patreon:
- Start measuring. We do this quantitatively in our retrospectives every two weeks.
- **Don’t just point people to the dashboard. **Instead, try to push them to a behavior where they are going into the space where they can find that for themselves.
- Build thoughtfully, reference frequently. We collated the most important resources and questions across the business into a Paper Doc and organized them by theme. Instead of adopting a discovery tool and throwing all users in there, we found it user-friendlier to use a UI they’re already familiar with, whether it’s Google Docs or Paper Doc or some sort of Slack FAQ. This has been very successful; hundreds of people across the company use this every week.
 **
A basic Paper Doc has proven effective in guiding users to the already existing dashboards they are looking for.**
**
A basic Paper Doc has proven effective in guiding users to the already existing dashboards they are looking for.**
- Data Discoverability dies in DMs. Answering Direct Messages does not scale. Directing users to a location where everything is collated in one place has two benefits.
- Others can later find the same answer/direction.
- Users learn to use that system when they have other questions.
- Use public channels instead of 1:1 direct messages. Collaboration platforms like Slack offer public group channels in addition to direct messages. This gives visibility both now and in the future and opens the content up to the search function of these platforms.
- **Use a catalog solution like Datafold Catalog. **Users see a list of all the core tables that power the majority of analytics across the company. This is valuable especially for helping data discoverability for engineers or colleagues who may not be technical but very data-savvy if they want to know what data we collect around specific topics.
- **Don’t feign surprise. This is important enough to me that it’s a norm and a core behavior of our team. **Feigning surprise doesn’t help at all; it doesn’t have any social or educational benefit. It generally makes people feel defensive and ashamed, and somewhat stupid. Even if they ask something so basic that it surprises you, don’t show that surprise because that doesn’t create the data culture that encourages questions and encourages folks to continue to ask. And I believe that if you start to stifle those questions, you end up with issues like people not going to a data scientist when they need help for a more challenging problem.
- Use a lineage tool. With lineage, you can see a map of all your data, but also you gain data discoverability as a contextual system.
Chassis: Entities, Events, & Change Management
by Chad Sanderson, Data Platform Product Team Lead, and Daniel Dicker, Data Platform Lead Engineer, Convoy

A presentation about Chassis, which deals with entities, events, and change management.
About Convoy
Convoy is a digital freight network founded in 2015. Right now, it’s worth about $2.75 billion. Based out of Seattle, it is a two-sided marketplace, with shippers on one side of the market and carriers and truckers on the other side of the marketplace.
About Data Science at Convoy
We add machine learning and artificial intelligence on top of that framework to price, batch, and group loads together. We’re a group of around twenty software engineers, data engineers, product managers, and EMs; we have billions of rows of data, which is relatively small for a company of our size, but our data is extremely complex. And we have a lot of very complex use cases that we deal with regularly. Our team owns the end-to-end data technology stack. That means everything from the source data, all the way up to the BI layer, the experimentation, and the machine learning layer as well.
Current Problems
- Brittle data warehouse
- Small changes can easily break downstream consumers
- Engineers don’t have a lot of visibility into who is consuming their data
- Adds complexity to our production systems as well
- Production data model doesn’t represent the real world
- Engineers moving quickly, building out new services, not treating data as a first-class citizen
- Changes to a services internal database schema have a big blast radius; this is problematic and hard to change.
- Postgres databases are not so good about telling us what happened in the past. There are a lot of mutable rows, meaning that we overwrite values.
Takeaways
- We need to start treating our data as a public API!
- We need a good mechanism for recording rich semantic events
- Capture what happened in the real world
- Abstracting away our analytics data model will increase engineering and data science innovation velocity.
- Recording semantic events would greatly simplify many data science tasks and improve productivity.
Use cases for events
- ML feature computation
- Metrics
- Audit Logs / Entity History
- Stream Processing
The ERD (Entity Relationship Diagram)

So we focused on what we call the ERD - Entity Relationship Diagram. This is our abstract data model that reflects our entities, their relationships, and the occurring events. This was created over multiple quarters with input from many participants.
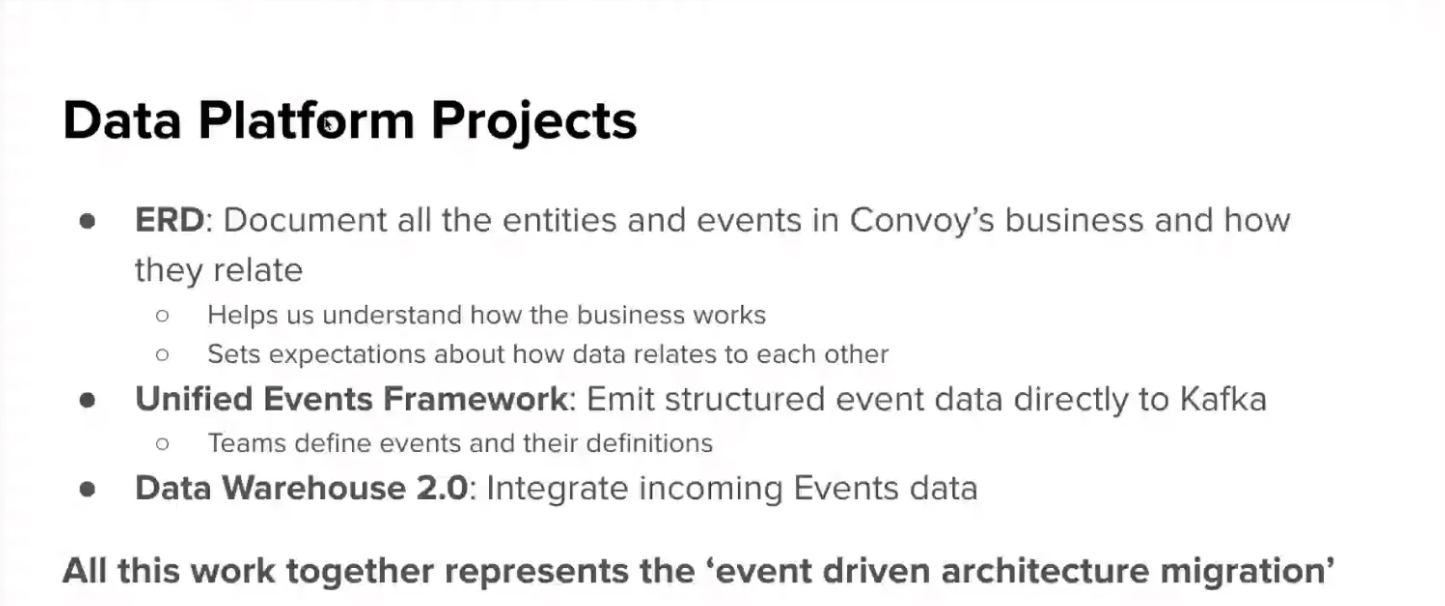
The ERD, combined with our Unified Events Framework and our Data Warehouse 2.0, represents our event-driven architecture migration.
One key challenge to adopting event-driven architecture is the complex change management required, the coordination across different systems, and making discovery of events and the related data feasible.
Goals:
- Create a single source of truth
- Standardize how changes are made to the entity and event
- Make it accessible so that anyone in the organization can make changes
- Automate as much as possible to reduce errors
What is Chassis?
- **Source of Truth for Definitions: **Repository of definitions for events, entities, and relationships.
- **Change Management Platform: **Frictionless UI for making changes to Convoy’s ERD and Unified Events Framework.
- Anyone can make (propose) changes.
- Changes are reviewed by owners and relevant stakeholders
- Approved changes are implemented by engineers
- Automation keeps all systems in sync and monitors for discrepancies
- Automation:
- Validation of production code
- Updating tables based on new definitions
- Updating documentation in Amundsen to reflect changes
Data Hydration at Yelp
by Benjamin Douglas, Technical Lead for Search Infrastructure, Yelp

About Yelp
We’re a platform that connects people with great local businesses. This is done primarily through reviews that the users of our platform use businesses and review them on the platform and use that information to discover other businesses and which ones they want to use. Last year, we had about a quarter-billion different reviews and 31 million active users.
Data Science at Yelp
So, in short, we have a lot of data and many users looking for that data. And that’s where the search team comes in.
While a Yelp result looks pretty basic, there actually are quite a lot of different pieces of information in this snippet that come from a variety of different places.

For example, the name and address may come straight from a database column, but the photo is just one chosen from 1000s based on different factors.
Early approach:

This is simple, but the hydration became a bottleneck.
First improvement:

Adding a cache is always the first step, but it didn’t help much because Search on Yelp has a very long tail (just a few places are searched often, but many, many businesses get searched only occasionally).
Better solution: Materialized View

So what we came up with was essentially a cache with a 100% hit rate. We don’t go and fetch the hydration logic at runtime; we pre-compute it offline so that when a user asks for it, it’s already been pre-computed. This is kept alive by having an indexer listen to changes in our SQL backends. And whenever we detect a change in a row in one of the databases, we issue the hydration logic for that business and feed it into the materialized view. This process has greatly impacted and sped up our fetching time.
But operationally, keeping this up and running has been problematic.
Downsides of Ad-Hoc Batch
- Change Management is difficult
- How will a change in the code affect the data?
- When do we need to backfill?
- No introspection or history
- When was a change to a row made?
- When was a row deleted?
Optimal Solution: Data Pipeline Indexer

We have already had a pretty sophisticated ETL pipeline built up over the years at Yelp called the Yelp Data Pipeline. This is used primarily for back-end and offline data work, things like log processing, training ML models, etc. (There’s a lot more information about how the pipeline works on the Yelp Engineering Blog.)
But just to give a very brief summary, it is based on Kafka, where the data is flowing from different sources into Kafka streams. And then, it uses Flink as a transformation layer to apply transformations to that data, which is exactly the kind of thing that we needed in retrospect.
Upsides of Proper ETL Pipeline
- Change Management more reliable
- Code organized in pipeline by property
- Schematized streams
- Better tracking
- Ability to feed (meta)data into other stores like data lake
- More functionality
- Rewinding
- Snapshotting
Modeling Data with Metrics: It’s all just Semantics
by Oliver Laslett, Co-Founder & CTO, Lightdash

Why do Analysts exist?
When we take raw data, aggregate it, and present it in a useful way, we add value to the business. We want to spread data throughout the organization.

Three ways to answer questions with data

Putting everything in the warehouse will simply flood users with data.

Giving complete answers to end-users will put an excessive burden on data teams.

Giving users meaningful building blocks allows them to piece data together without starting from scratch:
Metrics give your end-users understandable building blocks to answer their own questions.
Our perfect building blocks
- Explore meaningful business entities
- Users, Orders, Clicks, Emails
- Choose from relevant metrics
- Revenue, Sales, Conversions
- Filter data to relevant subsets
- Geography, time, business area
- Segment data into groups
- Geography, time, status, product
- Metrics/Measures: Calculations over our entities
- Dimensions: Attributes about our entities
- Filters: Segments and Subsets
So now you’re probably thinking, Where can I get myself a semantics layer? When I am not talking about metrics layers, I’m building one with the team at Lightdash.
Lightdash is a BI tool that’s completely metrics layer native. We have our own, and we integrate deeply with DBT. You write your metrics in DBT, and we surface up a user experience for people around your business to query common metrics. You can catch us on GitHub, download our tool, launch it, especially if you already have a DBT repo; you just stick Lightdash right on top. And you can experience some of those metrics layer goodness.
Panel Discussion

Panelists (from left to right, top to bottom)
- Maura Church, Director of Data Science @ Patreon
- Benjamin Douglas, Technical Lead for Search Infrastructure @ Yelp
- Gleb Mezhanskiy [Moderator], Co-founder & CEO @ Datafold
- Oliver Laslett, Co-Founder & CTO @ Lightdash
- Chad Sanderson, Data Platform Product Team Lead @ Convoy
- Daniel Dicker, Data Platform Lead Engineer @ Convoy
What is the right place to define the business logic? On the one hand, we have these SQL workflows and frameworks like DBT. On the other hand, we have BI tools, like Looker or Lightdash. What is the best practice? Or do we need a third tool?
Separate/Abstract Metrics from Data Modeling
When we’ve traditionally thought about metrics, we wanted to abstract them fundamentally far enough away from data modeling tools like DBT because, in terms of the stakeholders who care about metrics, it’s a lot more than just data scientists or analysts. We have Operational Managers, Product Managers, even Executives who care a lot about metrics but know very little SQL.
The ideal definition surface would be version-controlled, git-based, but with the same ownership and governance parameters as any other first-class data entity. We actually built a metrics repository internally on GitHub. It’s pretty naive at the moment, but the goal is to abstract away the concept of a business definition of a metric, a semantic meaning of it, and then have a way for that definition to evolve naturally over time. It’s like different actors want to make changes to it.
Ensure Metrics are Meaningful to Everyone
Metrics have to be meaningful to everyone, and also everyone needs a way to contribute. But under the hood, choosing anything other than SQL just makes your life much more difficult. We decided it would be great to have metrics in DBT, and it’s really cool. It’s interesting to hear the other point that it’s better for people not to have to get involved with DBT.
The pattern that we were seeing, which might not be true at all organizations, was that people who wanted to define metrics maybe didn’t have the necessary skills. If you have a way for business users to maintain those definitions and contribute, then actually, I can see doing that inside of DBT. There’s a lot of additional complexity that they don’t want to handle.
Metrics in BI can get messy
** **The philosophy for us was to write them in DBT and make it as thin of a layer as possible on top of the models and top of the SQL. Push the work to DBT, where we can manage transformations well. I’ve seen some Looker repos get really, really messy, a lot of business logic scattered in different places. Data teams tend to keep their transforms nice and tidy and version controlled. Our philosophy was to keep the metrics layer thin. And most data teams probably would prefer to maintain that inside of DBT. And DBT has announced that they’re elevating metrics, we kind of existed in this meta tag in DBT, which is like a free for all YAML structure. So we injected metric definitions there. DBT has announced that they’re going to upgrade that to a first-party entity, which is pretty exciting.
That said, the one thing I always say about the metrics layer, and about all these different implementations that are cropping up, is that the rest of the business can self serve, that you build a really good user experience on top of it. And I fear that if the metrics layer becomes too generic, it’d be something that more serves the technical teams and doesn’t enable us to build really good data experiences on top of it. So there’s this balance between being easy for the technical teams to maintain, but simultaneously it needs to be opinionated enough to build data user experiences on top of it.
Too much abstraction can actually become confusing
I’m just coming at it from a slightly different perspective than the rest of this group. I’m not actually on a data team, but I ingest the work of data teams. And it’s interesting to hear you talk about adding this like intermediate layer because what sometimes ends up happening, when we look at these sort of more generic metrics, as opposed to looking at the lowest level, we start to build up the imagination of what that means. There is a tendency to add abstractions and make things simpler and more accessible for people to understand. But if you do that too much, then there’s too much of a gap between the people using the data and the people defining the data. And that you could get yourself confused. And [instead of making it easier], you’re ending up in a different direction.
It will be interesting to see what the future holds
I think the scope of the data team’s work is massively increasing. And it’s going to be interesting how the organization reacts. Because even with platforms that focused on giving data as an API, some were more focused on maintaining full compatibility with SQL. I don’t think there is yet a consensus of what model works best.