
Data Quality Meetup #5
Doordash, Rocket Money, Appfolio, Evidently.ai, and Narrator share valuable insights at the fifth Data Quality Meetup hosted by Datafold.

Our fifth Data Quality Meetup took place on August 26th, 2021. If you haven’t had a chance to do so yet, check out our digest and recordings of the lightning talks from Data Quality Meetup #4. You can RSVP for the upcoming session here.
Lightning Talks
Activity Schema - A path to a single source of truth
*by Ahmed Elsamadisi - CEO, Narrator AI*Everyone loves a single source of truth. It is the holy grail of data.

So why don’t we create a single source of truth?
In theory, creating a single source is actually easy: you build data models that have the data you need, and you point all your visualization, materialization, and everything else you need at that right data model.
But reality is not so simple: real-world data comes from different sources, and you can’t just sum up the data; everybody has experienced the frustration of “Hey, the numbers don’t match!”
There can be many reasons for this, among them
- Different types of data are being recorded (e.g., page views vs. sales orders)
- SQL bugs due to complex queries
- Inconsistent events (e.g., not every website visit has an associated sales order)
- … and many more
We have a solution for this: create one single table of data
We transform all raw data into a massive, single table. The structure of this table is a series of events we call activities. For example: customer did activity over time.
Pros:
-
A single source of truth
-
The numbers will always match
-
Easy to build Cons:
-
Hard to query (but see more on that below)

The easy part: build the Activity Schema
With a bit of practice, building the activity schema is quick and simple: a few tiny SQL snippets, usually written in 10-15 minutes, are all that is needed for a large variety of data sources. In essence, all relevant data is simply mapped into the activity stream.
The initially-not-so-easy part: querying the Activity Schema
In a simplified example, our activity stream contains “website visits” and “orders.” For each website visit, did the same person place an order before the next visit? If so, “1”, if not “0”. This new column of 0s and 1s will tell us:
- number of visits (count of rows)
- number of orders (count of 1s)
- conversion rate (average of all rows)
This simple approach can be generalized.
What we did above was a “First in-between” query. If there was an order between visits, that previous visit generated a sale.
There are other typical queries:
- First in Between…
- Last Before…
- First After… and more.
Almost any question can be formed with just 11 such relationships.

These 11 time-based operators, combined with a single source of truth activity stream, are the core of the activity schema.
Easily understandable for humans, but hard to code in SQL
While these 11 time-based operators look beautifully simple, they are actually quite complex to implement in SQL. Therefore, we have written an app that translates queries using these time-based operators into actual SQL. Auto-generating these SQL queries will avoid the only complicated step and give you a comprehensive solution to have a single source of truth that is easy to generate and easy to query.
Summary
Activity schema is a unique approach to generate a single source of truth, the activity stream.
- Transform existing data into an activity stream using a few tiny SQL snippets.
- Formulate questions using a finite list of 11 time-based operators in an intuitive, human-understandable format.
- Auto-generate [complex] SQL queries for these questions, and query the activity stream.
Leading a thriving analytics organization
*by Katya Ogai, Director of Analytics, AppFolio*My background and how it shaped my view of org structure
I’m currently director of analytics at AppFolio, supporting the Investment Management product. Before that, I was at Twilio and Lending Club. Each organization had a different structure for its analytics teams:
- Lending Club had a centralized analytics team
- Twilio had a decentralized analytics team
- AppFolio currently has a hybrid model
Let’s go over these three models as well as their pros and cons:
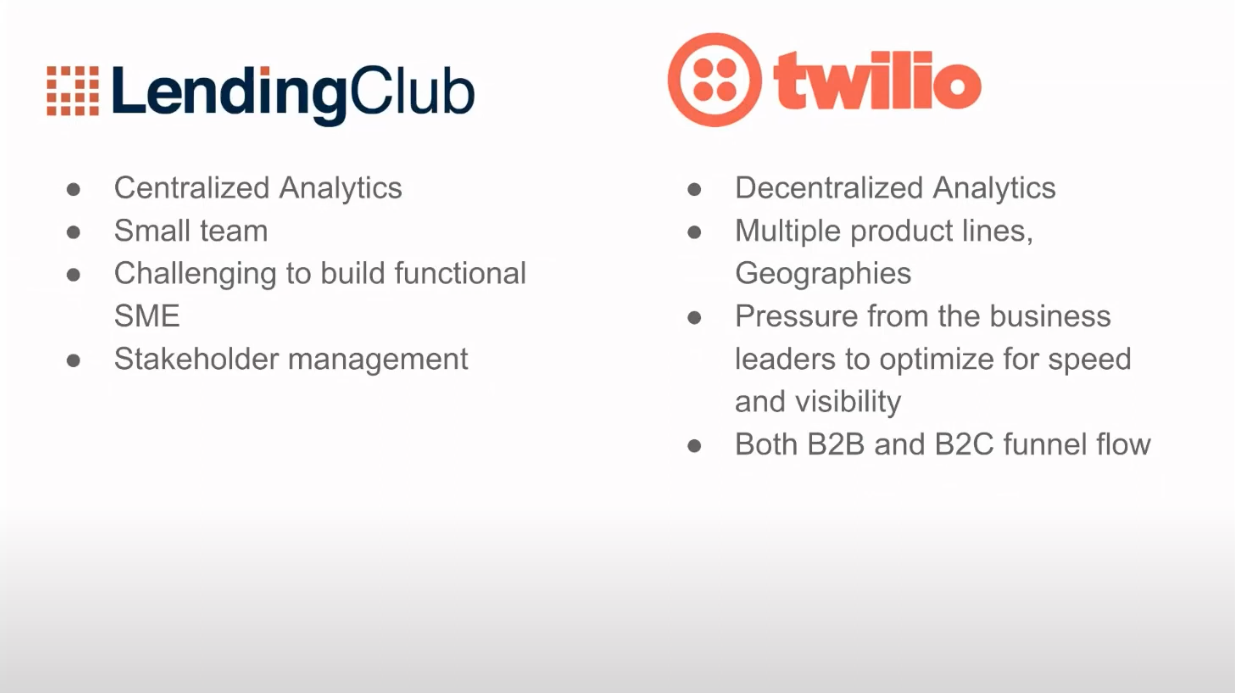
The Centralized Structure (example, LendingClub)

At Lending Club, I was the first analyst, and it was sort of like a startup organization within a larger company. This setup gave me a lot of control over what metrics and analytics look like and what’s sustainable for the scale and the size of the company at the time.
This structure works really well for a startup, but I believe it’s never too early to put a little bit of thought behind how you want to continue developing your organization and growing it, and being prepared for scale.
The Decentralized Structure (example, Twilio)

I later joined Twilio, a more complex business with multiple product lines and global operations, both B2B and B2C. Twilio had a decentralized analytics organization. One challenge was the pressure from the business stakeholders, who are more focused on optimizing for speed and visibility and balancing that with the spirit of analytics of building for scale and tackling the more foundational work.
The Hybrid Structure (example, AppFolio)

Finally, at AppFolio, we have the hybrid structure, which is what I favor most. Here, the analysts still have a formalized relationship with the analytics work, but there are dotted lines into the departments. This provides the best of both worlds, really the technical and business mentorship and support, and allows analysts to serve as an independent thought partner to the business.
The one thing to watch out for here is that this dual reporting structure can sometimes be confusing for the analyst. Another point that I think is important is this cross-functional focus where analysts can have a primary department they support, but then a secondary focus, which allows for higher cross-collaboration and opportunities for synergies.
Summary
Analytics team should think about how to structure their team:
- A centralized approach when close control over the team is needed
- A decentralized approach when speed and business expertise is crucial
- A hybrid approach that balances both needs and allows analysts to be knowledgeable yet independent partners of the business.
Streaming ML Pipelines using Apache Beam and Cloud Dataflow
*by Gilbert Watson, Senior Data Scientist at Rocket Money*Change in Apple’s ad tracking requires new solution for LTV estimation

In the past, we used Apple’s ad data for LTV (lifetime-value, a widely used marketing metric) estimation. But with their new SKAdNetwork, this data is no longer available on the user level.
Due to this, our batch (every 2hrs) LTV ML pipeline was too slow - we needed a real-time pipeline.
What changed?
- Apple’s change was pretty significant; before, we could exactly match which ads brought what customer to the app, and we could measure accurately which ads were the most effective.
- Apple then removed that link between what ads users saw and what we knew our users were doing in the app.
Our solution
To overcome this drastic change, we had to use our data to generate an estimate for LTV.

For the core element - the streaming ML pipeline - we decided to use Apache Beam, including Cloud Dataflow on Google’s cloud, to build that streaming ML pipeline for LTV estimation.
Why did we choose Apache Beam on Google Cloud Dataflow?
So let’s talk more about this middle piece. Because that’s, that’s what we’re here for today. Why did we go with Apache Beam? And Google Cloud Dataflow? It’s got support for Python, Go, Java. So there are lots of options there. Most importantly, it’s just a nice abstraction. And it was super easy—roughly 20 lines of code.

How did we implement it?
We designed an ML engine that reads in all those events and near real-time, creates feature sets, and makes ML predictions on the top of those feature sets. It dumps those predictions and expectations to another pub/sub. We deliver those expectations to the user’s device via background app push. That way, we can use Apple’s new measurement solution.
So how well does it work?
From what we can see today, it works really well!
With a relatively minimal setup (three n2-highmem-8 machines), we produce over 60 predictions per second, which completely covers our needs.

The time delay, which was approx. 2hrs with our old batch process was reduced to just 20-30s latency of the entire pipeline.
Data Drift and Early Monitoring for ML Models
*by Emeli Dral, CTO at Evidently AI*I want to share some insight into how a database can serve as an early monitor for machine learning models.
How do ML models break when you put them in production?
- Generally, many things can go wrong!
- Very common: input data is wrong (measurement broken, outages, etc.)
- Also common: data processing issues, schema changes, broken upstream models

What if everything works right, but something is still off?
Sometimes, everything is right, but we still get unexpected results.
- Gradual change in the target function: market share slowly growing, user base slowly shrinking
- Sudden change in the target function: recent pandemic led to many sudden changes in many areas If we don’t notice such long-term changes, our ML models can become irrelevant.


How is monitoring data technology or specifically machine learning technology different?
While data and ML, of course, share some of the underlying problems that need to be monitored, like resource utilization and uptime, there are many additional factors to be considered, and they can be grouped into
- Data health degradation
- Model health degradation

Specific example: bicycle rentals
Here is an example for data drift on a dataset of short-term bike rental. Daily rental patterns are dependent on many factors like day of the week or short-term weather, but another big factor are seasonal changes in the temperature outside.
Let look at an example of bike rentals during spring, when the temperature outside gets warmer.

For a detailed walkthrough of the drift analysis of the bicycle demand, please watch the video of the talk.
Summary
Properly monitoring data tech and ML models requires specific tools, and is able to very early detect and alert if there are problems with the data or the model.
Panel Discussion: lessons from DoorDash, Narrator, AppFolio, Rocket Money and Evidently
Panelists (from left to right)
- Emeli Dral, CTO @ Evidently AI
- Gleb Mezhanskiy [Moderator], Co-founder & CEO @ Datafold
- Gilbert Watson, Senior Data Scientist @ Rocket Money
- Katya Ogai, Director of Analytics @ AppFolio
- Akshat Nair, Engineering Manager @ DoorDash
- Ahmed Elsamadisi, CEO @ Narrator AI
What is the data structure or prevailing data modeling approach that you use in the organization?
- **A combination of both: **data that comes out of any generic CDP integration looks very much like the event style data Ahmed proposed, and we’re heavy users of that for analytics purposes. But we’re also old-school users of a star schema because our star schema runs our production database, and we often have to answer questions about what’s going on in there. So we use a combo approach.
- **Evolving towards activity schema: **we also have, a similar approach, it’s a combination approach. Definitely, we are evolving more towards using activity schema, but for transactional processing, and answering a lot of our financial reporting, we are using the star schema.
- Not necessarily always a specific strategy: it’s definitely a combination, we could probably be a little bit more disciplined or purposeful with it. But sometimes you just need it a certain way, and it may not fall under a specific strategy.
How have you seen the function of analytics evolve in your organization and how has that impacted the effectiveness to deliver data reliably?
- **Increasing shift from answering requests to proactive and self-serve: **a lot of our customers are shifting from playing catch up and answering requests to being proactive and allow people to self serve their own questions. A lot of the stakeholders are able to actually answer their own questions, to make a lot of the first and second-order decisions on their own. That lets the embedded analysts shift into thinking about the big questions.
- **From historical reporting to thought partner for the business: **there’s definitely a shift towards data analytics having a seat at the table, thought partners, and not request takers, because we have a lot of large-scale understanding of what’s happening from a data perspective.
- **Hybrid organization: **we definitely have that hybrid approach where we have analysts embedded within different teams. And there is a two-way reporting structure. That gives us an advantage that those analysts have a better understanding of supporting their verticals but also being able to learn from each other.
- **Data science embedded, data engineering central: **currently, we do have data science and analysts embedded, data engineering is still centralized. So that way, the infrastructure and the needs are fulfilled for various analysts and data science folks are centralized from the data platform perspective.
- Too far away from business stakeholders does not work well: having an analyst without a business use case is like using a technology without a business case. Any structure that removes embedded analysts, I’ve never seen that be successful. You always have to have some sort of embedded relationship with your product stakeholders.
Do you expect every person who does last-mile data delivery to be able to do the data preparation themselves?
- **Data warehouse centrally managed, data usage individually: **data delivery into the warehouse and data lake are being managed by the central team. How to use it is up to the analysts and the data science folks. And we also let them bring in more data sets by building a self serve data platform, But we do manage a standardized platform so that we are not, you know, going in 100 different directions.
- Analysts should be able to script their own sources: I’m not a big fan of the belief that analytics does not need to code or does not need to touch the underlying rows and columns. I’m very much a proponent of analysts’ ability to script their own data sources.
- Depends on the company size: I think it really depends on where you are as a business; if you work in a tiny startup, the different work you have to do as a data scientist, for example, really spans everything. But as you grow, your control needs grow. And I’ve worked at very large companies before, particularly in finance, and there are many benefits to those organizations having more control.
- **The pendulum swings both ways: **we saw this transition left to right, right to left many times. We would give everyone open-ended control to create the data model that they needed. And then every team [would have different numbers] and the CEO would ask: who’s right? And the decentralized teams are now going and debugging all their queries. And then, we’re going to control the data models and create bigger and more powerful data models. And what would happen is, everything would be blocked by engineering. [And it would move back to more open-ended.]
For someone starting with machine learning and who just got the model in production, what are the top three things they should think about?
- **Observability: **in reality, we’re usually in catch-up mode. So we’re usually reactive with what we do after we get it to production. But the observability piece is always the hardest piece that seems to come up as a reactionary thing after the fact.
- **Monitor Service Health: **maybe because I have more engineering background, I would say that it’s very important that when you move your machine learning model in production, it makes sense to start monitoring service health. You might need to start logging more, I mean, more events, more metrics, but all the other infrastructure should also be used there.
- **Monitoring: **monitoring is super important, hire some people who know how to do that stuff.
- **Underlying assumptions for models: **most people ignore the assumptions that are made when we create these models. And you can see, once they start thinking about the assumptions made, they realize that, okay, this model works in these 17 specific conditions. And once one of them breaks, this model is going to behave very differently than expected. Make sure that you write down those assumptions, it can help with monitoring to help narrowing down what we monitor.