
How to Onboard Analytics Engineers


[Guest blog by Kenny Ning, Freelance Analytics Engineer]
The diary of an analytics engineer…
9:30 Nothing like your first day at a new job! Time to show these folks what I can do!
11:05 Just came out of my first manager 1:1. He shared a google doc with me and named some important tables to check out, so I guess I’ll start there.
12:02 Got into Snowflake. Okay so he said to start with user_facts. Also it looks like in the #data Slack channel people are asking if user_facts is behind again. Looking at the dbt model, I think it’s only one pesky column that’s causing the whole table to fail. Removing it should do the trick.
1:42 Opened a pull request and tagged some people to review. I’ll let the people in #data know a fix is coming.
2:03 I’ll just merge it now, since it should be pretty simple.
2:36 Uh-oh, I think I broke something.
3:06 Looks like an important dashboard used that column and broke because of my change. Merging code is scary!
You’ve finally hired an analytics engineer on your team, but what are you doing to make sure this story isn’t about their first day? Fail to have a proper onboarding experience and your analytics engineers will lose the initiative and enthusiasm that you hired them for in the first place.
Over my eight years of experience working in data, I’ve had the pleasure of scaling data teams at Spotify and Better at the peaks of each of their growth stages. Recently, I’ve been helping smaller data teams build and improve their onboarding process as an analytics consultant. The two biggest questions I observe from new hires are:
- Orientation: What tables are most important? How do they get populated?
- Downstream impact: Who is using this table or column? Will anything break if I change it?
Here are my suggestions on how to accelerate a new hire’s understanding of your data:
- Merge their code
- Invest in developer workflow tools
- Have them use your product
- Use lineage graphs
Note that this post will focus more on the “technical” aspects of onboarding and not things like HR, compliance, or IT access.
Merge their code
The wrong lesson to take away from the story above is to discourage merging code for new hires until after they’ve onboarded. On the contrary, I think every hiring manager should set a goal to have all new hires merge code on their first day. I view this exercise as an interactive way to complete standard onboarding tasks like getting access to the right systems.
To see what I mean, let’s say you give the following first task to a new hire:
Remove the <span class="code">type</span> column from <span class="code">businesses.sql</span>.
The workflow to do this is simple enough:
- Clone the dbt repo locally
- Delete <span class="code">type</span> from the select statement
- Run <span class="code">dbt run</span> to test
- Go to your data warehouse console to inspect the output in your dev schema
- Push the code change to a branch
- Open a pull request
- Make sure tests pass and/or get an approved review from a teammate
- Merge your change
For even this simple workflow, think about all the systems that need to be configured properly:

The list of prerequisites will likely match your general onboarding list of requirements. This means that if a new hire successfully merges their first code change, they’ll likely have already completed 90% of general onboarding as well, but within the context of a real problem.
That being said, deleting a column is a pretty risky change. We need to make sure that no downstream tools are using that column. You can check this by asking around or checking your BI tools manually, but a better way is to invest in developer workflow tools that do this for you.
Invest in developer workflow tools
When dashboards break and table builds start failing, the knee-jerk reaction is to slow development velocity and add manual review processes. The highest functioning teams I’ve worked on don’t do this because they know that, in the long run, slower iterations are more costly than broken dashboards. Instead, they use the opportunity to invest in more developer workflow tooling that automates testing, which allows them to reduce downstream incidents while maintaining a fast pace of work.
Here are two great tools that can help you de-risk analytics engineer code changes.
Spectacles
Spectacles runs automated tests on your Looker pull requests to check for SQL errors or downstream dashboard errors. If you use dbt with Looker, you can also set up tests on dbt pull requests to make sure that your model changes don’t break anything in Looker.
Datafold
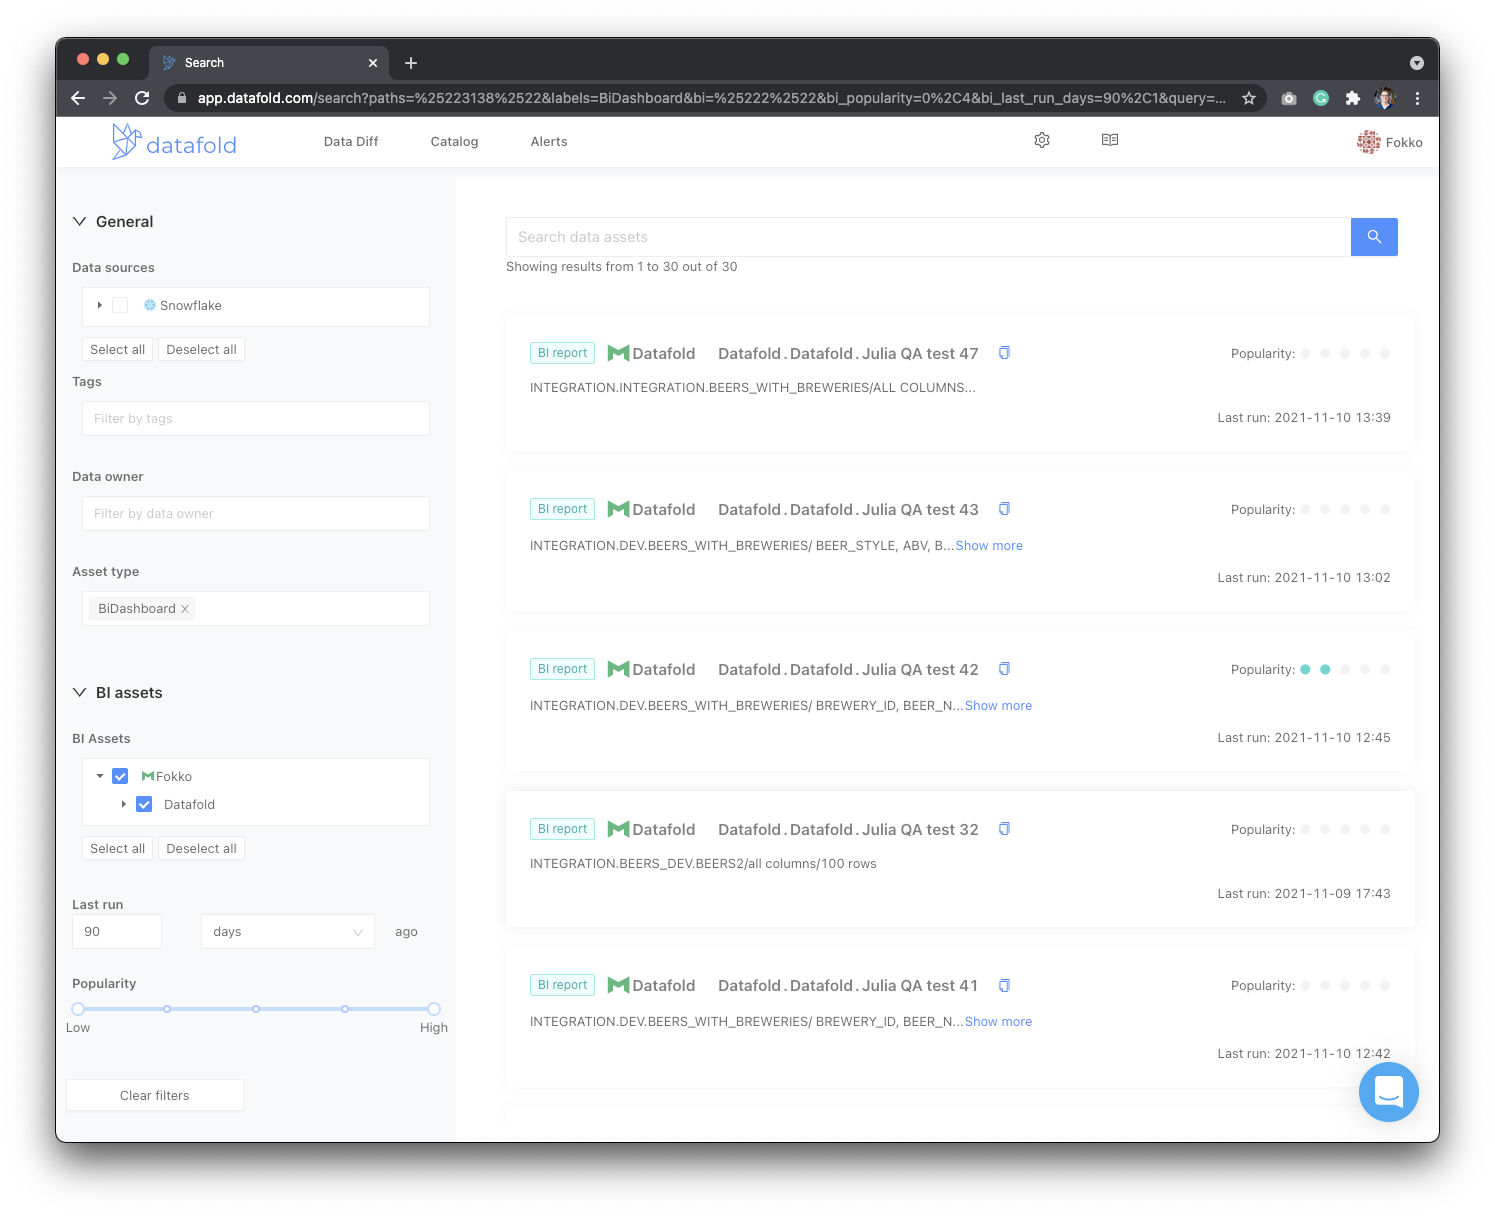
This is a Datafold blog post after all, so of course we’d have to mention it ;). The column-level lineage feature is particularly noteworthy in the context of helping new hires get oriented with your company’s data ecosystem.
In the example above, you could use this tool to look up the <span class="code">type</span> column and quickly confirm that the column is, indeed, unused by any downstream assets. In the video walkthrough below, you can see that the <span class="code">id</span> column is referenced in two downstream dbt models, but <span class="code">type</span> has no downstream dependencies.

Datafold’s flagship product, data diff, also has a CI integration that generates an impact report showing how your proposed changes would impact downstream dependencies. In the example above where we removed the <span class="code">type</span> column, data diff would flag a difference in columns (expected), but more importantly it would throw an error at PR time if any downstream runs failed as a result of your change. A new hire certainly won’t be able to figure out for themselves all the ways their change could go wrong, so having an automated testing process becomes even more crucial in the context of onboarding.


Have them use your product
Most companies will have a “staging” version of their product that is separate from their “production” version that serves real users. The definition of “staging” varies across companies, but generally it’s used by developers to sandbox and test changes before they hit real users. What most data teams miss is that your company’s staging app can be a huge asset for understanding how product actions get logged in the database.
.png)
For example, when I worked at Better, every time a new data hire asked me how we stored credit score, income, or any other field in our signup flow, I would say "go to staging, create a test account, submit some fake info into the mortgage application form, and look at your data in staging postgres". Okay, so maybe I wasn't the most popular person to ask for help, but the ones that actually went through this exercise received a much deeper answer to their question and were much more empowered later on to answer their own questions.
What happens if your company doesn't have a staging sandbox set up? You can still go through the “production” version of your app to get a sense of the user flow, but make sure to mark your username / email as a very clear test account so you can filter it out later. For example, if your company uses Gmail, you can sign up with an alias like <span class="code">kenny+test@company.xyz</span> and then filter out all email accounts with <span class="code">+test</span> at the analysis step.
Lastly, if your company uses Segment as their event tracker, check out the Segment chrome extension. It’s a great addition to the built-in segment debugger since it allows you to see all the different events that get fired when you take certain actions on a page.
Use lineage graphs
If you’re using dbt as your primary data pipelining tool, don't forget about the lineage graph tucked away in the bottom-right corner of the docs site. To educate a new hire on how raw data gets transformed into analyst-friendly tables, this is the first picture you should show them:

This is a really simple and powerful way to explore your dbt project. However, it doesn't tell the whole story, namely:
- it only visualizes table-level relationships
- it only visualizes transformation jobs in dbt
Table-level is a good start, but it doesn't tell you the individual pieces of data that are most critical across your data stack. You can enrich the picture above with dbt sources and exposures, but those must be manually curated and as a result I rarely see that metadata being added at companies I've worked with.
We've already mentioned Datafold column-level lineage above as a way to reduce risk for code changes. But this tool is valuable in general to gain a deeper understanding of your overall data ecosystem. For example, if your company uses Mode, you can ingest those reports into Datafold's catalog with a few simple steps for a more reliable view into how your data makes its way into your BI tools.
Because Datafold's strategy is to ingest metadata from all parts of the data stack, it's the best place to see how data flows end-to-end, from production to data warehouse to transformation to BI tools and eventually even activation layers like sales and marketing tools. For giving new hires a single place to quickly understand your whole data stack, Datafold is the dream tool 🔮
Other tips
I threw a lot of words at you just now, so here are some last tips to keep in the back of your mind:
- Assign an onboarding buddy (ideally a fellow data team member who’s at least three months in) for the first month to pair program and field questions
- Learning by doing is faster than passively reading docs
- Wait at least one month before considering a new hire as fully productive
- Data engineers are going to be new hires' biggest unblockers (or blockers...), so get that relationship started off first
- Tag easy, low-risk tickets in your backlog with "good onboarding task" so it's easy to find these when new hires join
- Use code (e.g. dbt docs) as the primary vehicle for documentation, not plain text google or notion docs which get stale quickly
Lastly, if you’re someone’s onboarding buddy, remember to be patient, be responsive, and, most importantly, show them how they can answer their own questions in the future. For example, if they ask you whether or not a table is used, give them a quick answer and then link out to the lineage tool that you used to find the answer.
The bottom line
It should be every onboarding manager's goal to empower a new analytics engineer to merge their first line of code on day one. Encourage them to use your product and browse available data lineage graphs to gain a broad understanding of your company’s data ecosystem.
Lastly, invest in tools like Datafold to help you de-risk code changes so you can make onboarding faster and safer.
The diary of an analytics engineer (take 2)
9:30 Nothing like your first day at a new job! Time to show these folks what I can do!
11:05 Just came out of my first manager 1:1. He assigned me my first task to remove an unused column and told me to reach out to my onboarding buddy, X, for any questions.
12:02 Opened a pull request, and someone asked me to make sure nothing would break downstream. I pinged my onboarding buddy, and they pointed me to Datafold’s lineage tool.
12:12 I pasted a screenshot of the column in the lineage tool showing there were no downstream dependencies.
1:03: I got the approval. Merging code is easy!
Datafold is the fastest way to validate dbt model changes during development, deployment & migrations. Datafold allows data engineers to audit their work in minutes without writing tests or custom queries. Integrated into CI, Datafold enables data teams to deploy with full confidence, ship faster, and leave tedious QA and firefighting behind.